Machine Learning modeling
Statistical hypotheses: ANOVA test
Here is one result of our ANOVA test:
Question is :
Does the personal consumption vary based on different representative movie category per month?
From the result, we can see that since P-value is 0.024, which is much lower than the significant level 0.05 or 0.1, thus we can reject the h0 hypothesis and consider that personal consumption does vary based on different representative movie category per month. Thus, it is statistically significant that taking the personal consumption attribute into the machine learning model will help build a better model.
ANOVA result list:
| Variable | P-value | Result |
| Real_Disposable_Personal_Income | 0.032421 | Reject H0 put in to model |
| Personal_Consumption_Expenditure | 0.024296 | Reject H0 put in to model |
| Treasury_Constant_Maturity_Rate_10_Year | 0.063129 | Properly Reject H0 put in to model |
Real_Disposable_Personal_Income P-value:0.032421 —> (reject h0)
Personal_Consumption_Expenditure P-value:0.024296 —>. (reject h0)
Treasury_Constant_Maturity_Rate_10_Year P-value:0.063129 (reluctantly reject h0, but can also put into the final model since P-value is not high)
…..
Model building :
First Trial
More variables with less training data
Using 10-fold and cross-valid method to split the data the final accuracy of test data is:
| Models | Accuracy |
| KNN | 0.21 |
| CART | 0.16 |
| Naïve Bayes | 0.14 |
| SVM | 0.14 |
| Random forest | 0.22 |
| Logistic Regression | 0.25 |
However the accuracy is not as good as we expected, and we suspect that it is caused by the problem of data limitation, which is the lack of training data. As random forest should have a high accuracy than other models generally, while in this case, it does not achieve its potential, thus we consider a lack of data as the cause. (Our data is based on a monthly level, thus 10 years can give us only a little amount of data )
Since our data is based on monthly economic resource, in order to increase the amount of data, we need to broaden the time horizon from 2003-2011 to 1980-2011 at the sacrifice of some valuable variables which do not own a range down to 1980, such as retail_food_sale, related-stock change as some stock-related companies are not open to the public until 1995 and 2000.
Second Trial
Fewer variables with more training data
After broadening the time range of data, we successfully increase the monthly data from 106 to 382, increase by more than 350% percent.
| Models | Accuracy |
| KNN | 0.27 |
| CART | 0.24 |
| Naïve Bayes | 0.27 |
| SVM | 0.25 |
| Random forest | 0.30 |
| Logistic Regression | 0.27 |
Our random forest model’s accuracy has been increased up to more than 30%, which is a big improvement compared to the baseline accuracy of our 16-class classification model, which is 1/16 = 6.25%
Now let’s look at the result of the classification model.
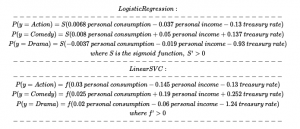
To be simple, I just extract the parameters of LinearSVM and Multi-class Logistic regression.
LogisticRegression:
[per_consumption, per_income, treasury_ma]
[ 6.78860341e-03, -3.75306464e-02, -1.29090439e-01],
[ 4.13449855e-03, 4.93000987e-02, 3.92859687e-01],
[ 8.20688441e-03, 5.03760721e-02, 1.36663719e-01],
[ 4.44501935e-03, -4.75412673e-03, -7.12468355e-02],
[-3.70924132e-03, -1.86979582e-02, -9.30464484e-01],
[-2.53319913e-02, -4.15040247e-04, 2.28821694e-02],
[-1.47740621e-02, -1.04342313e-02, 1.96687223e-01],
[ 5.98540638e-03, 9.87903021e-04, -3.18856167e-02],
[ 1.72448928e-02, 4.78285854e-03, 3.20696107e-02],
[ 7.38588017e-03, -1.18712487e-02, 4.47611059e-02],
[ 2.96358700e-04, -7.35685295e-03, 7.94433142e-02],
[-1.60591906e-02, -2.50480637e-03, 2.21374320e-01],
[ 2.43973745e-02, -2.02009747e-02, 1.00888489e-01],
[-1.22466181e-02, 1.12729158e-02, -8.13903349e-02],
[-5.56754146e-03, -4.11944937e-03, 2.94500025e-02],
[-1.19627331e-03, 1.16548686e-03, -1.30019313e-02]
LinearSVC:
[per_consumption, per_income, treasury_ma]
[ 0.02966774, -0.14471867, -0.1282059 ],
[-0.00527054, 0.18164961, 0.4827523 ],
[ 0.02486671, 0.19207659, 0.25187282],
[ 0.01620719, -0.01925257, -0.07194419],
[ 0.02076962, -0.05778987, -1.23964571],
[-0.10527764, -0.00393354, 0.03419578],
[-0.07094835, -0.04614407, 0.22302254],
[ 0.02035817, 0.00216132, -0.03231524],
[ 0.0618008 , 0.01550899, 0.03794849],
[ 0.02249799, -0.04897322, 0.05007795],
[-0.00676591, -0.03216929, 0.08877703],
[-0.07750835, -0.01590667, 0.25169932],
[ 0.08732982, -0.08230996, 0.11911246],
[-0.04832314, 0.04340531, -0.07246604],
[-0.02776916, -0.01860495, 0.03311367],
[-0.00873979, 0.00258575, -0.01250391]
genre:
[‘Action’, ‘Adventure’, ‘Comedy’, ‘Crime’, ‘Drama’, ‘Family’,
‘Fantasy’, ‘History’, ‘Horror’, ‘Music’, ‘Mystery’, ‘Romance’,
‘Science Fiction’, ‘Thriller’, ‘War’, ‘Western’]
Extracted Formula:
The results from Logistic Regression and Linear SVC are consistently similar.
However, while analyzing the parameters of the classification model, the weight matters!
As the numerical value range of each variable is the same (-100%,100%), weight matters.


