Homework

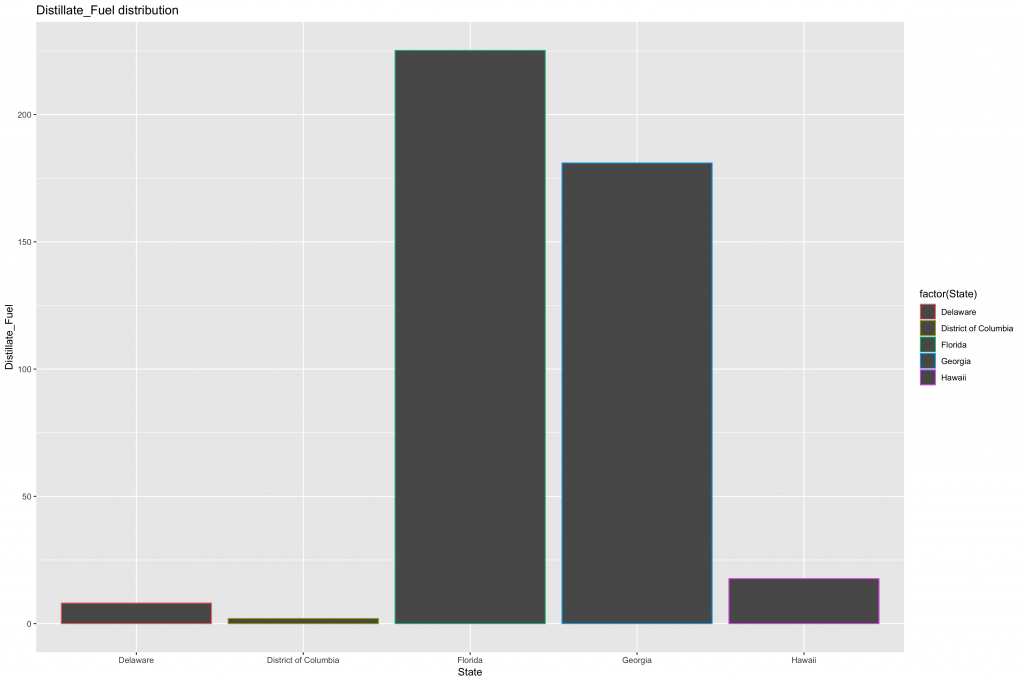
From the above, we can see that Florida and Georgia have

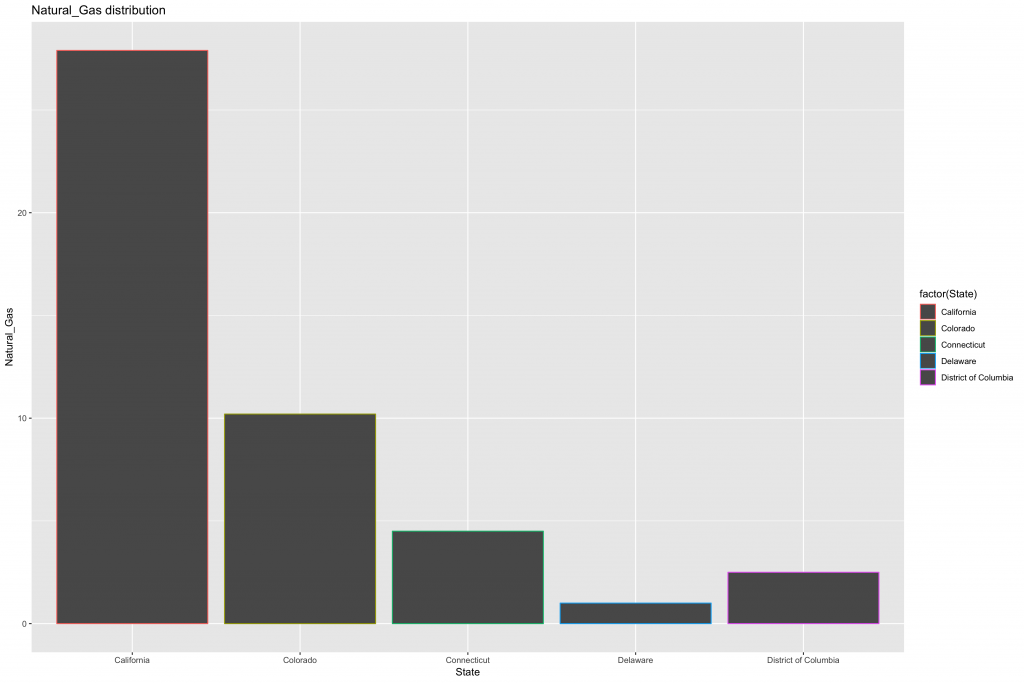
From the

From the above
It has some extreme value around 16000.
Python plotly

From the above
It has some extreme value around 2900.
From the above we can see that most of the state’s usage of Net energy are in the range of 0-990, while it still has an extreme value around 25k.
About 8% of the data concentrate between 1000-4500.
R plotly
From the above we can see that most of the state’s usage of Net energy are in the range of 0-990, while it still has an extreme value around 25k.
About 8% of the data concentrate between 1000-4500.